The Best Forex Indicators for Beginner Traders
Starting your Forex trading journey can feel overwhelming with hundreds of indicators available on trading platforms. Many beginners make the mistake of cluttering their charts with too many tools, creating confusion instead of clarity. In this guide, you'll learn about the most effective and beginner-friendly Forex indicators that can help you identify trends, momentum, and potential entry points without overcomplicating your analysis.
Moving Averages: Your Foundation for Trend Analysis
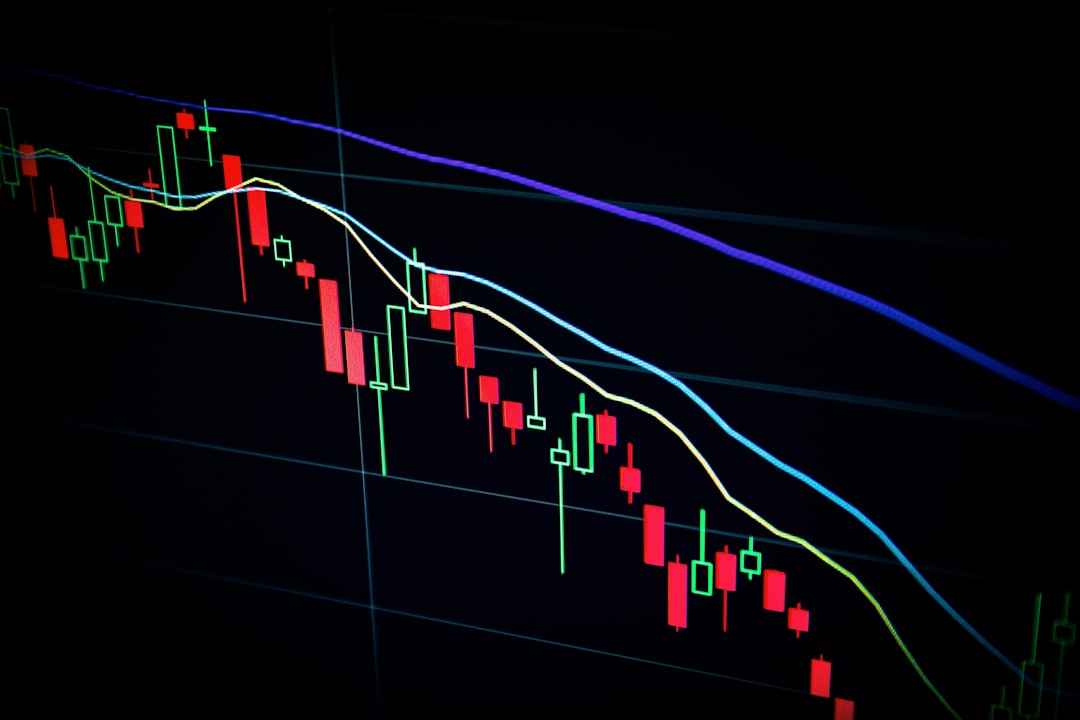
Moving averages are among the simplest yet most powerful indicators for beginners. They smooth out price data by calculating the average price over a specific period, helping you identify the overall trend direction. The two most common types are the Simple Moving Average (SMA) and the Exponential Moving Average (EMA).
The SMA gives equal weight to all price points in the period, while the EMA places more emphasis on recent prices, making it more responsive to current market conditions. Most traders start with the 50-period and 200-period moving averages on daily charts. When the shorter-term average crosses above the longer-term average, it suggests an uptrend (bullish signal). When it crosses below, it indicates a downtrend (bearish signal).
Beginners should focus on using moving averages to:
- Identify the dominant trend direction
- Spot potential support and resistance levels
- Generate basic crossover signals for entry timing
Relative Strength Index (RSI): Measuring Momentum
The RSI is a momentum oscillator that measures the speed and magnitude of price movements on a scale from 0 to 100. This indicator helps you identify when a currency pair might be overbought (potentially ready to fall) or oversold (potentially ready to rise).
Traditional RSI interpretation suggests that readings above 70 indicate overbought conditions, while readings below 30 suggest oversold conditions. However, in strong trends, the RSI can remain in these extreme zones for extended periods. Beginners should use RSI in combination with trend analysis rather than trading oversold and overbought signals in isolation.
The RSI also helps identify divergence—when price makes a new high or low but RSI fails to confirm it. This divergence often signals potential trend reversals and provides valuable early warnings for position adjustments.
MACD: Combining Trend and Momentum
The Moving Average Convergence Divergence (MACD) combines the benefits of moving averages with momentum analysis. It consists of three components: the MACD line, signal line, and histogram. This indicator excels at showing both trend direction and momentum shifts.
When the MACD line crosses above the signal line, it generates a bullish signal. When it crosses below, it produces a bearish signal. The histogram shows the difference between these two lines, with expanding bars indicating strengthening momentum and contracting bars suggesting weakening momentum.
For beginners, the MACD works best on:
- 4-hour and daily timeframes for clearer signals
- Trending markets rather than ranging conditions
- Confirmation of signals from other indicators
Comparing Essential Beginner Indicators
| Indicator | Primary Function | Best Used For | Complexity Level |
|---|---|---|---|
| Moving Averages | Trend identification | Direction and support/resistance | Low |
| RSI | Momentum measurement | Overbought/oversold conditions | Low |
| MACD | Trend and momentum | Crossovers and divergence | Medium |
| Bollinger Bands | Volatility measurement | Price extremes and breakouts | Medium |
Bollinger Bands: Understanding Volatility
Bollinger Bands consist of a middle moving average line with two standard deviation bands above and below it. These bands expand during periods of high volatility and contract during calm market conditions. This visual representation helps beginners understand market volatility without complex calculations.
When price touches or moves outside the upper band, it may indicate overbought conditions. When it reaches the lower band, it suggests oversold conditions. However, in strong trends, price can "walk the band" for extended periods. Beginners should watch for band squeezes—when bands narrow significantly—as these often precede major price movements.
Bollinger Bands work particularly well when combined with RSI or MACD for confirmation signals, reducing false signals and improving entry timing.
Building Your Indicator Strategy
The key to success with indicators isn't using more tools—it's using the right combination effectively. Start with just two or three indicators that complement each other. For example, use moving averages for trend direction, RSI for momentum confirmation, and MACD for timing entries.
Avoid indicator overload by following these guidelines:
- Use one trend-following indicator (moving averages)
- Add one momentum oscillator (RSI or MACD)
- Consider one volatility measure (Bollinger Bands) if needed
- Test your combination on a demo account before risking real money
Remember that no indicator is perfect or predictive. They analyze historical price data and help identify probabilities, not certainties. Always combine indicator analysis with proper risk management, including stop-loss orders and position sizing appropriate for your account.
As you gain experience, you'll discover which indicators match your trading style and timeframes. Some traders prefer the simplicity of moving averages alone, while others combine multiple tools. The best approach is the one you understand thoroughly and can apply consistently in various market conditions.
Master these fundamental indicators before exploring more complex tools. Understanding how these core indicators work provides a solid foundation for developing your trading skills and making informed decisions in the Forex market. Practice on demo accounts, observe how indicators behave in different market conditions, and gradually build confidence in your analytical abilities.