How to Identify Market Trends More Accurately
Identifying market trends accurately is one of the most essential skills for successful Forex trading. Many beginner traders struggle to determine whether the market is trending up, down, or moving sideways, leading to poor entry and exit decisions. In this guide, you'll learn practical methods to recognize trends more reliably using technical indicators, price action patterns, and multi-timeframe analysis that professional traders use daily.
Understanding the Three Types of Market Trends
Before identifying trends, you must understand the three basic market directions. An uptrend occurs when prices make higher highs and higher lows, indicating bullish momentum. A downtrend features lower highs and lower lows, showing bearish pressure. A sideways trend (or range) happens when prices move horizontally between support and resistance levels without clear direction.
Recognizing which trend type is active helps you choose appropriate trading strategies. Trend-following strategies work best in clear uptrends or downtrends, while range-trading techniques suit sideways markets. The key challenge is distinguishing genuine trends from temporary price fluctuations or market noise.
| Trend Type | Price Structure | Best Strategy |
|---|---|---|
| Uptrend | Higher highs, higher lows | Buy on pullbacks |
| Downtrend | Lower highs, lower lows | Sell on rallies |
| Sideways | Horizontal movement | Range trading |
Using Moving Averages to Confirm Trends
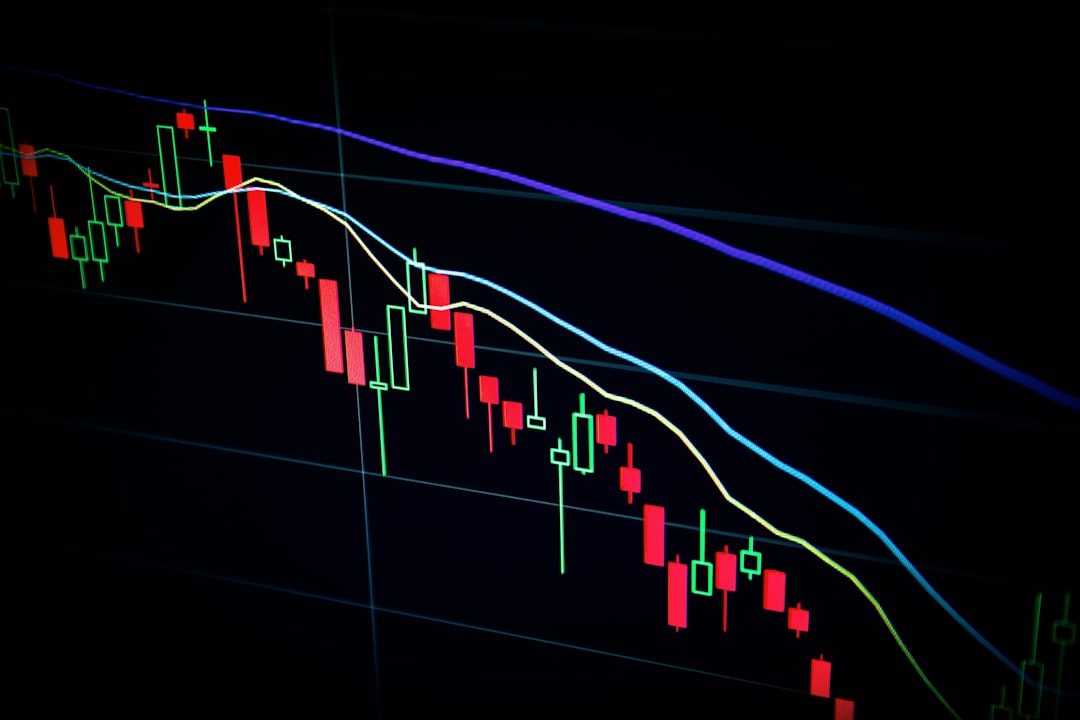
Moving averages are among the most reliable trend identification tools. The 50-period and 200-period moving averages help smooth out price noise and reveal the underlying direction. When price stays consistently above the moving average, it confirms an uptrend. When price remains below, it signals a downtrend.
The moving average crossover technique provides additional confirmation. When a shorter-period MA (like the 50) crosses above a longer-period MA (like the 200), it creates a bullish signal called a "golden cross." The opposite creates a "death cross,