How to Read Forex Charts as a Beginner Trader
Reading Forex charts can feel overwhelming when you first start trading currencies. You see lines, candles, and indicators that seem like a foreign language. Understanding how to interpret these visual representations of price movement is fundamental to making informed trading decisions. In this guide, you'll learn the essential components of Forex charts, different chart types, timeframes, and how to identify basic patterns that help predict market direction.
Understanding the Three Main Chart Types
Forex charts display price movements over time, but they come in different formats. The three primary chart types are line charts, bar charts, and candlestick charts. Line charts connect closing prices with a simple line, offering a clean view of overall price direction but limited detail. Bar charts show open, high, low, and close prices (OHLC) for each period using vertical bars with small horizontal ticks. Candlestick charts display the same OHLC information but use colored rectangular bodies and wicks, making patterns easier to spot visually.
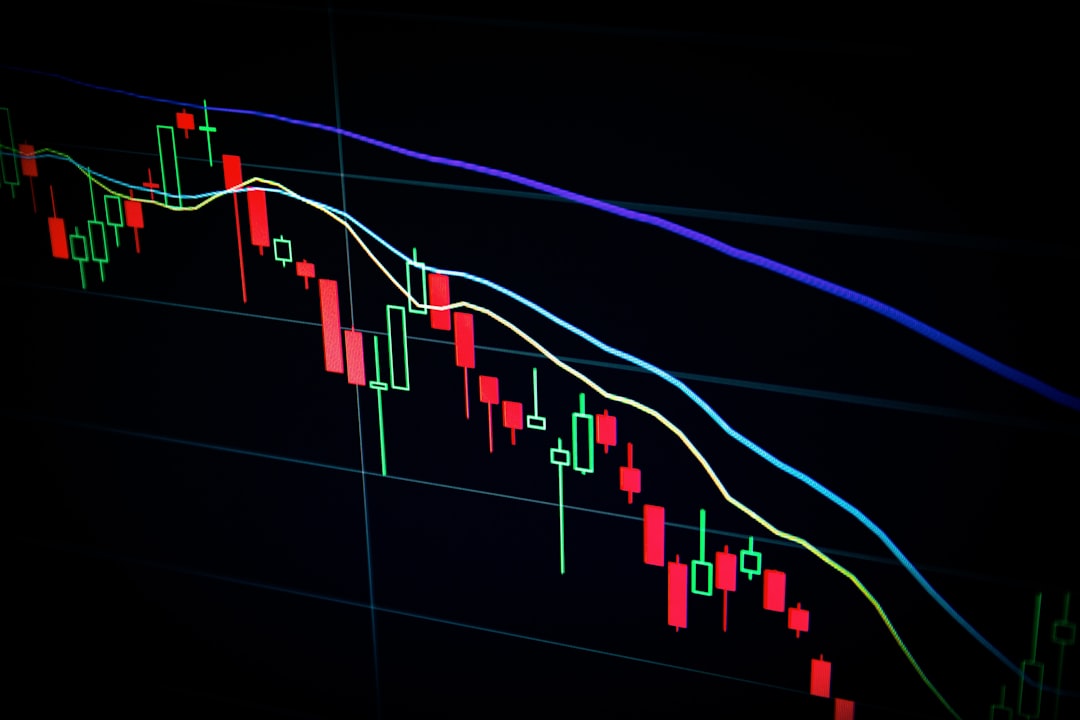
Most professional traders prefer candlestick charts because they provide immediate visual feedback about market sentiment. A green or white candle indicates the price closed higher than it opened (bullish), while a red or black candle shows the price closed lower (bearish). The body represents the range between open and close, while the wicks (or shadows) show the high and low extremes during that period.
Choosing the Right Timeframe
Every Forex chart can be viewed across multiple timeframes, from one-minute charts to monthly charts. The timeframe you choose depends on your trading style and strategy. Day traders typically use 5-minute, 15-minute, or 1-hour charts to capture short-term price movements. Swing traders focus on 4-hour and daily charts to hold positions for several days or weeks. Position traders analyze weekly and monthly charts for long-term trends.
As a beginner, start by analyzing the daily chart to understand the bigger picture, then zoom into shorter timeframes for entry and exit points. This top-down approach helps you align your trades with the dominant trend. Remember that lower timeframes generate more noise and false signals, while higher timeframes provide more reliable trend information but fewer trading opportunities.
Identifying Support and Resistance Levels
Support and resistance are horizontal price levels where the market has historically reversed direction. Support acts as a floor where buying pressure prevents prices from falling further. Resistance acts as a ceiling where selling pressure stops prices from rising. These levels form when price touches a certain area multiple times without breaking through.
To identify these zones on your chart, look for areas where price has bounced or reversed at least two times. Draw horizontal lines at these levels. When price approaches support, it may bounce higher. When it nears resistance, it might reverse lower. However, if price breaks through these levels with strong momentum, support can become new resistance (or vice versa), a concept called role reversal.
| Chart Element | What It Shows | Trading Application |
|---|---|---|
| Candlestick Body | Open to close price range | Immediate price direction and strength |
| Candlestick Wicks | High and low price extremes | Rejection levels and market indecision |
| Support Level | Price floor with buying interest | Potential entry points for long positions |
| Resistance Level | Price ceiling with selling pressure | Potential entry points for short positions |
| Trend Lines | Direction of price movement | Trend following and breakout strategies |
Recognizing Basic Trend Direction
Trends represent the general direction of price movement over time. An uptrend consists of higher highs and higher lows, indicating bullish momentum. A downtrend shows lower highs and lower lows, signaling bearish pressure. A sideways trend or range occurs when price moves horizontally between support and resistance without clear direction.
To identify trends, draw trend lines connecting the swing lows in an uptrend or swing highs in a downtrend. Trading with the trend increases your probability of success because you're aligning with the dominant market force. The phrase "the trend is your friend" exists for good reason—most profitable trades follow the direction of the established trend rather than fighting against it.
Putting It All Together
Reading Forex charts becomes easier with practice and screen time. Start by selecting a currency pair, choose your preferred timeframe, and identify the current trend. Mark key support and resistance levels, observe candlestick patterns forming at these zones, and wait for confirmation before entering trades. Remember that chart reading is a skill that develops gradually—focus on understanding one concept at a time, practice on demo accounts, and keep a trading journal to track what patterns work best for your strategy. Master the basics before adding complex indicators to your charts.