What Is Technical Analysis in Forex Trading?
Technical analysis is one of the most popular methods Forex traders use to predict future price movements. Unlike fundamental analysis, which examines economic news and events, technical analysis focuses purely on historical price data and chart patterns. If you're new to trading, understanding technical analysis can help you identify entry and exit points, manage risk, and develop a systematic approach to the markets. In this guide, you'll learn what technical analysis is, how it works, and the key tools traders use to analyze currency pairs.
What Is Technical Analysis?
Technical analysis is the study of past price movements to forecast future market behavior. It's based on the idea that all market information—economic data, news, trader sentiment—is already reflected in the price. By analyzing charts, patterns, and indicators, traders attempt to identify trends and reversals before they happen.
The core assumption is that history tends to repeat itself. Traders look for recurring patterns in price behavior, believing that similar conditions will produce similar outcomes. Technical analysis can be applied to any timeframe, from one-minute charts for scalpers to weekly charts for swing traders.
Key principles of technical analysis:
- Price moves in trends (uptrends, downtrends, sideways)
- History repeats itself through patterns and cycles
- Market action discounts everything (price reflects all known information)
Core Tools of Technical Analysis
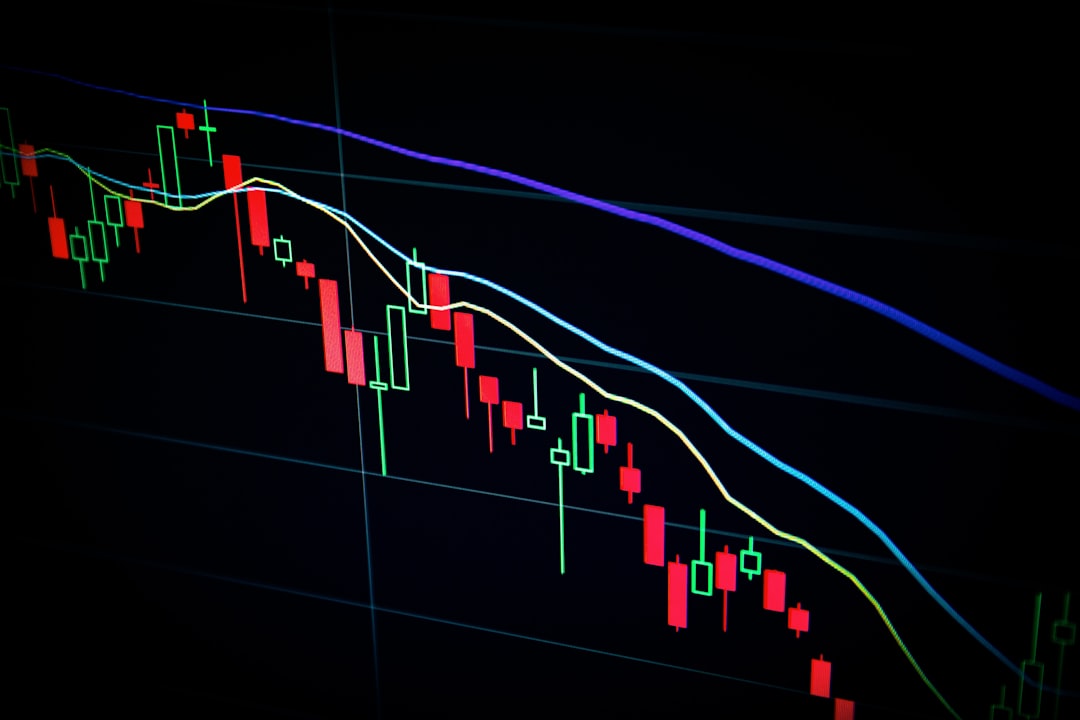
Technical traders rely on several tools to study price action. The most important are price charts, which display historical price data visually. Common chart types include line charts, bar charts, and candlestick charts. Candlestick charts are the most popular because they show opening, closing, high, and low prices for each period, making patterns easier to spot.
Indicators are mathematical calculations based on price and volume. They help confirm trends, measure momentum, and signal potential reversals. Common indicators include moving averages, Relative Strength Index (RSI), and MACD. These tools don't predict the future with certainty, but they provide probabilities and help filter out market noise.
Chart patterns such as head and shoulders, double tops, triangles, and flags also play a major role. Recognizing these formations can give traders clues about where the market might go next.
| Tool Type | Purpose | Examples |
|---|---|---|
| Price Charts | Visual representation of price movement | Candlestick, bar, line charts |
| Indicators | Measure trends, momentum, volatility | RSI, MACD, moving averages |
| Chart Patterns | Identify trend continuation or reversal | Head and shoulders, triangles, flags |
| Support/Resistance | Key price levels where price tends to reverse | Horizontal lines, trendlines |
How Technical Analysis Differs from Fundamental Analysis
While technical analysis focuses on charts and price data, fundamental analysis examines economic indicators, central bank policies, political events, and financial reports. Fundamental traders believe that currency prices are driven by real-world economic conditions, such as interest rates, GDP growth, and employment data.
Technical traders, on the other hand, argue that all of this information is already priced into the chart. They focus on when to enter or exit, not why the market is moving. Many successful traders use a combination of both approaches—fundamentals to determine direction and technicals to time entries and exits.
Benefits and Limitations of Technical Analysis
Technical analysis offers several advantages for Forex traders. It provides clear, visual signals that can be backtested and automated. It works on any timeframe and any currency pair, making it versatile and accessible. Beginners can start learning with free charting tools and build strategies systematically.
However, technical analysis is not foolproof. Markets can behave irrationally, and patterns don't always play out as expected. False signals are common, especially in choppy or low-volume conditions. No indicator or pattern guarantees success. Proper risk management, discipline, and continuous learning are essential to using technical analysis effectively.
Advantages:
- Works on all timeframes and instruments
- Provides clear entry and exit signals
- Can be backtested and automated
Limitations:
- Does not explain why price moves
- Can produce false signals
- Requires practice and discipline
Getting Started with Technical Analysis
To begin using technical analysis, start with a reliable charting platform such as MetaTrader 4, MetaTrader 5, or TradingView. Learn to read candlestick charts and identify basic support and resistance levels. Practice drawing trendlines and recognizing simple patterns like double tops and triangles.
Next, choose one or two indicators to study in depth. Avoid overloading your charts with too many tools—this leads to confusion and conflicting signals. Focus on understanding how each indicator works and how it behaves in different market conditions. Combine your technical tools with sound risk management, and always use a demo account before risking real money.
Technical analysis is a skill that improves with practice. By studying price action, testing strategies, and learning from both wins and losses, you can develop a systematic approach to trading Forex with greater confidence and consistency.